October 24, 2006
Atlantic SSTs vs. U.S. Hurricane Damage – Part 2
In the comments of our first post on this subject FSU’s Jim Elsner, a widely respected hurricane expert, pointed us to a forthcoming paper (here in PDF) in which he and colleagues looked at the relationship of Atlantic SSTs and U.S. hurricane damage. In the paper Elsner et al. make the following claim:
Using the preseason Atlantic SST, we are able to explain 13% of the variation in the logarithm of loss values exceeding $100 mn using an ordinary least squares regression model. The relationship is positive indicating that warmer Atlantic SSTs are associated with larger losses as expected. The rank correlation between the amount of loss (exceeding $100 mn) and the May-June Atlantic SST is +0.31 (P-value = 0.0086) over all years in the dataset and is +0.37 (P-value = 0.0267) over the shorter 1950–2005 period.
I’ve looked at our dataset and find nothing remotely close like these numbers. Here is my analysis for 1950-2005:
The following graph [updated 10-25-06] shows the relationship of Atlantic May-June SSTs and U.S. normalized hurricane damage (for years in which damage exceeds $100M).
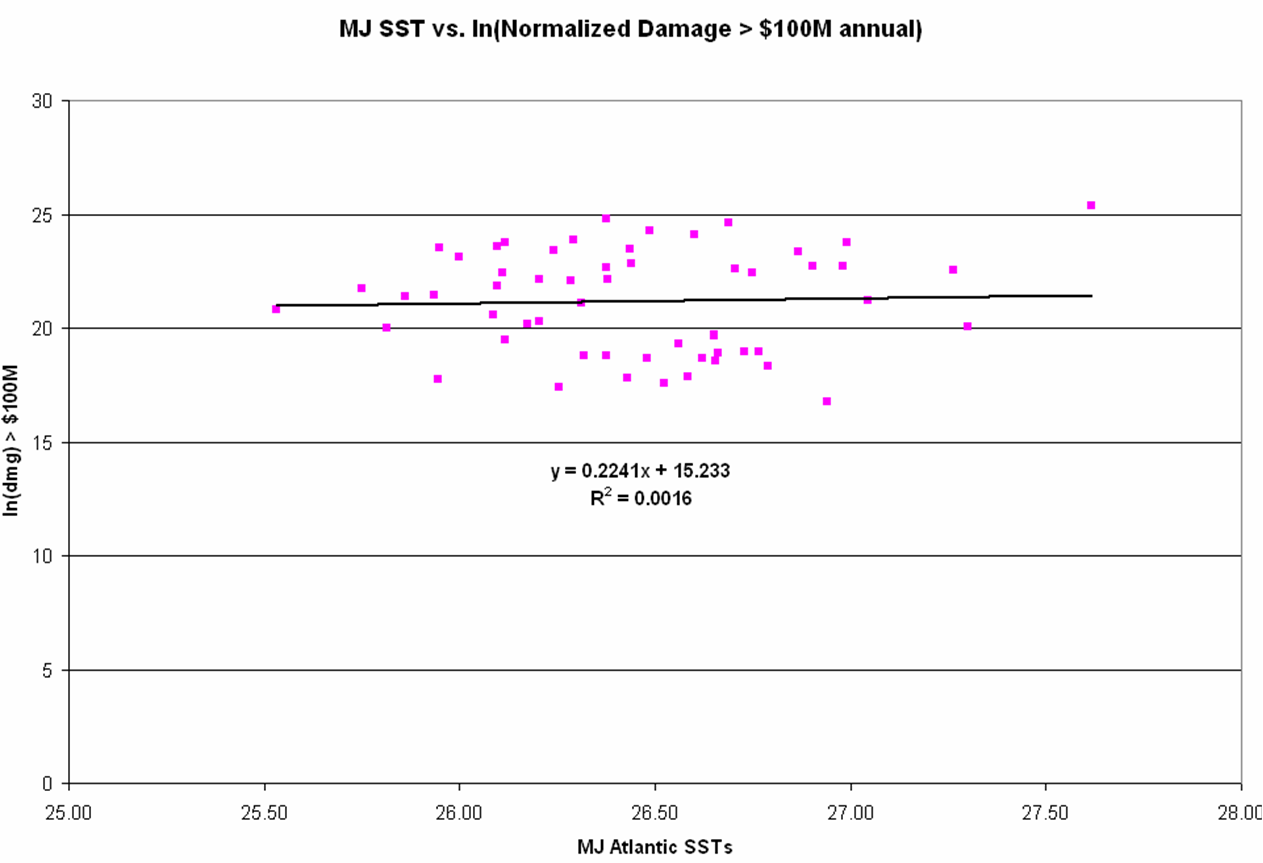
You can see from this graph there is no relationship; The rank correlation I get is -0.088. So I am curious about the reasons for the different results (leaving aside for the moment other questions). Are we using different data? To facilitate analysis, here is the data that I am using in this analysis (for all years 1950-2005, note that original NATL SST data is available here):
[UPDATED 10-25-06]
Year–MJ SST—Damage———-ln(dmg)
1950 26.11 $5,529,320,501 22.43333077
1951 26.65 $358,069,353 19.69623725
1952 26.66 $114,732,781 18.55811634
1953 26.59 $55,787,059 17.83705248
1954 26.49 $35,671,450,726 24.29761651
1955 26.29 $23,274,260,349 23.87061388
1956 26.18 $577,494,764 20.17420993
1957 26.29 $3,841,822,355 22.06921266
1958 27.30 $509,818,712 20.04956575
1959 26.09 $858,779,107 20.5710223
1960 26.60 $29,970,493,213 24.12347918
1961 26.24 $14,468,733,186 23.39525583
1962 26.79 $92,192,732 18.33939186
1963 26.56 $246,291,959 19.32202822
1964 26.44 $15,693,459,358 23.47650986
1965 26.12 $21,261,254,041 23.78015219
1966 26.65 $336,552,296 19.63426411
1967 26.21 $4,016,468,362 22.11366884
1968 26.21 $657,263,225 20.30359514
1969 26.99 $21,225,180,492 23.77845407
1970 26.75 $5,627,670,656 22.45096146
1971 25.94 $2,083,668,167 21.45739572
1972 26.10 $17,579,304,340 23.58998816
1973 26.32 $145,454,945 18.79537694
1974 25.53 $1,073,783,964 20.79445466
1975 25.75 $2,791,286,883 21.74976857
1976 25.82 $486,444,597 20.00263357
1977 26.43 $53,776,992 17.80035628
1978 26.38 $145,903,706 18.79845741
1979 26.87 $14,096,216,718 23.36917228
1980 27.05 $1,602,040,183 21.19454377
1981 26.77 $171,359,510 18.95927431
1982 26.53 $43,148,911 17.58016773
1983 26.98 $7,469,100,008 22.73404035
1984 26.12 $289,628,417 19.48410934
1985 26.00 $11,068,101,797 23.1273331
1986 25.95 $50,026,988 17.72807318
1987 26.94 $19,011,511 16.76055519
1988 26.73 $172,912,773 18.96829783
1989 25.95 $16,770,856,131 23.54290846
1990 26.62 $126,787,371 18.658022
1991 26.10 $3,044,037,453 21.83645058
1992 26.38 $57,663,865,630 24.77789657
1993 26.48 $126,479,971 18.65559452
1994 25.86 $1,938,752,062 21.38531034
1995 26.91 $7,501,957,030 22.73842976
1996 26.71 $6,537,460,457 22.60081462
1997 26.66 $163,560,186 18.91269159
1998 27.27 $6,021,601,438 22.51861908
1999 26.44 $8,277,977,785 22.83686455
2000 26.26 $36,525,742 17.41352783
2001 26.38 $6,970,450,131 22.66494564
2002 26.31 $1,491,060,293 21.12275331
2003 26.38 $4,212,081,525 22.16122279
2004 26.69 $49,130,243,738 24.61774064
2005 27.62 $107,350,000,000 25.39936036