January 8, 2014
A Different Look at the Income of the 99%

Here is how the New York Times recently characterized their work:
The top 1 percent took more than one-fifth of the income earned by Americans, one of the highest levels on record since 1913, when the government instituted an income tax.I was curious about how their data looked in absolute rather than relative terms -- after all the magnitude of incomes and number of earners both change dramatically over time. So I have conducted an empirical thought experiment. Let's pretend that the top 1% does not exist. (But in case you are curious, in 2012 the bottom 99% had a collective income of $6.85 trillion, not too shabby. In 2012 the top 1% had a collective income of $2 trillion or the entire income of the 100% in 1956. Wow.) But for analytical purposes, let us strike them and their income from the data. What then does the income of the bottom 99% look like over time?
The figures underscore that even after the recession the country remains in a new Gilded Age, with income as concentrated as it was in the years that preceded the Depression of the 1930s, if not more so.
High stock prices, rising home values and surging corporate profits have buoyed the recovery-era incomes of the most affluent Americans, with the incomes of the rest still weighed down by high unemployment and stagnant wages for many blue- and white-collar workers.
The answer can be found in the graph below (using the wonderfully user-friendly dataset made available by Emannuel Saez -- source here in PDF, hereafter SP13. Note I show their data without capital gains, its inclusion does not affect this analysis.):
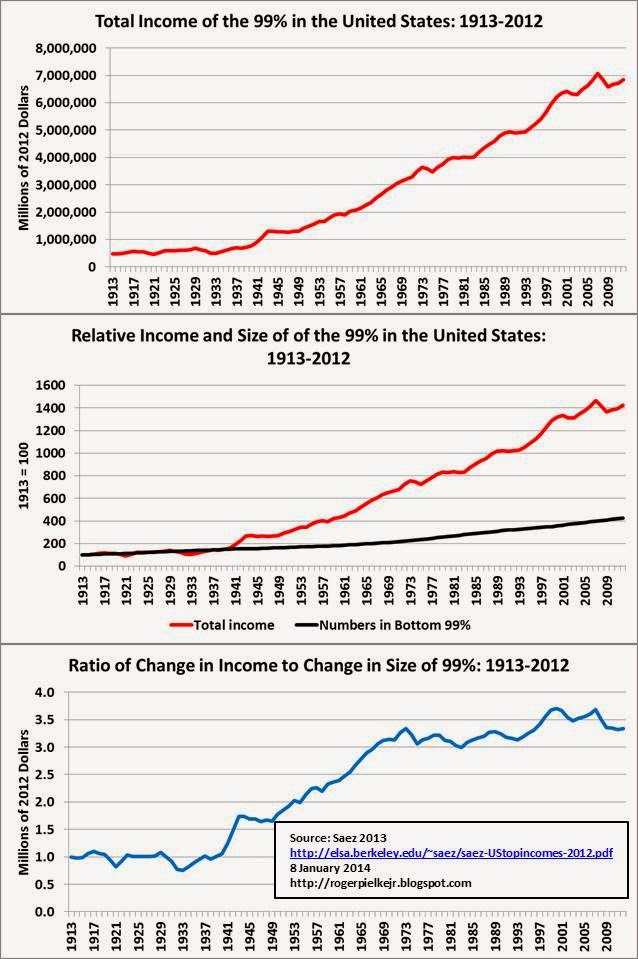
The inflection points match up nicely with the inflection points in the SP13 look at relative income (shown at the top of this post) associated with the proportion of income going to the top 10% and 1%.
The graph below shows the same data for 1980 to 2012.
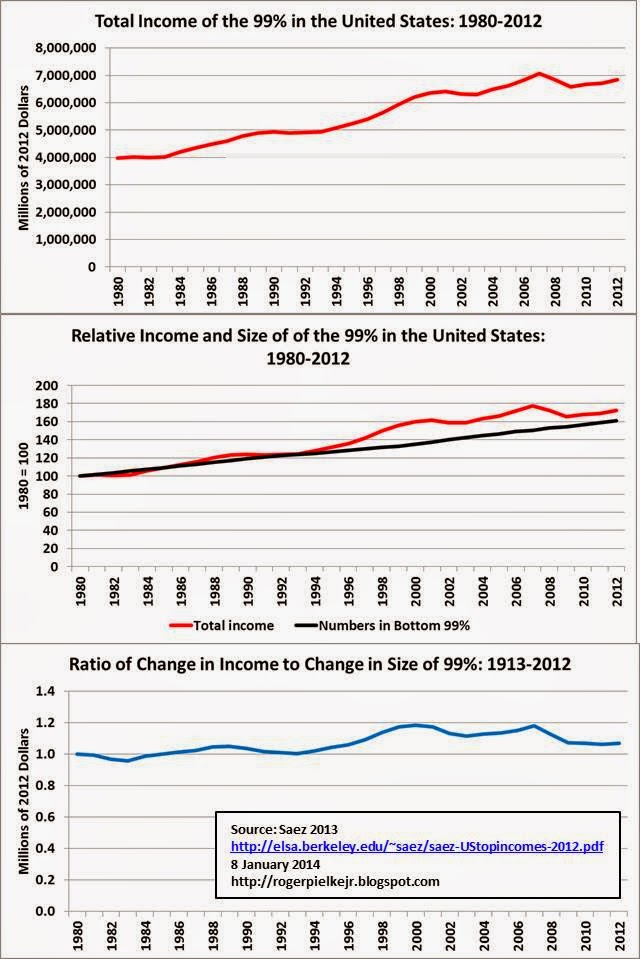
Clearly, with respect to total income growth in the US there was something quite different about 1940-1970 than the rest of the period. Was that demographics? Policy? Changing composition of the labor force? Technology? Put another way, was the mid-century growth in wages an anomaly or should it be expected as business-as-usual?
Comments welcomed.