December 30, 2013
Jobs in the US Economy 1948-2011
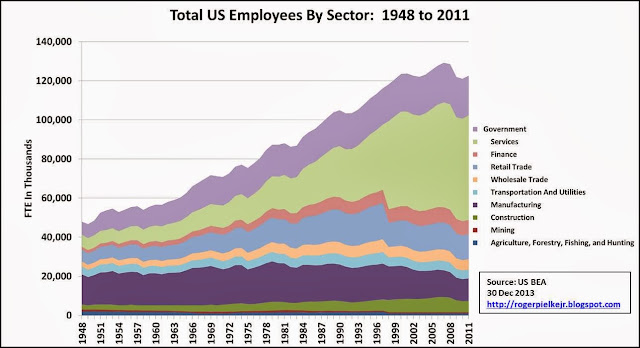
Some numbers:
- In 1948 the US had 48.0 million FTE jobs.
- In 2011 the US had 122.6 million FTE jobs.
- From 1948 to 2011 the US added 74.6 million FTE jobs, an increase of about 1.5% per year. (It was 1.3% from 1970 to 2011).
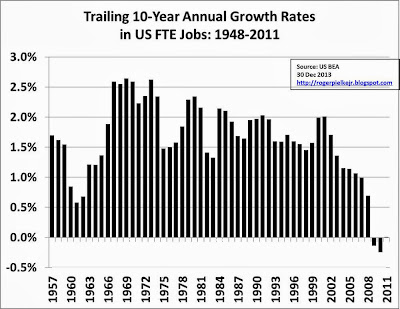
The figure below shows how the overall rate of job growth has changed over time. It shows the trailing 10-year annual growth rates in FTE jobs.
The graph below shows the same data in percentage terms.
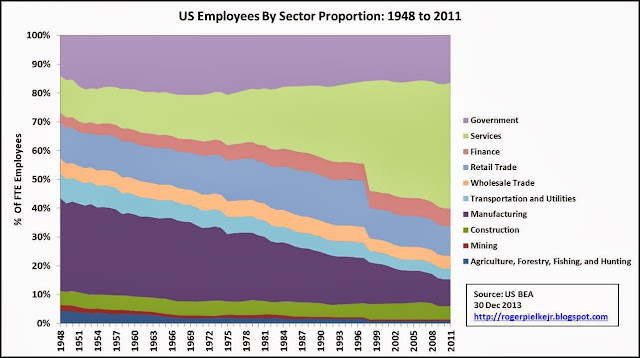
- In 2011 government accounted for a smaller percentage of jobs (16.5%) than it did in 1951 (17.6%).
- Manufacturing was 31.1% of all jobs in 1950; it was 9.4% of all jobs in 2011.
- Agriculture was 4.3% of all jobs in 1950; it was 0.9% in 2011.
- In 1950 finance and services were 16.7% of all jobs; in 2011 they were 49.7%.
Behind these numbers are some interesting dynamics. While manufacturing has shrunk dramatically as a proportion of all jobs, since 1950 the US has only seen a decrease of 3.7 million manufacturing jobs. Over that same period the US has added 47.1 million service jobs. Government has remained remarkably stable as a proportion of jobs, but has added 13.8 million jobs since 1950, but most of those were added before 1970.
Here is an interesting thought experiment:
Consider that from 1970 to 2001 jobs in the overall economy grew by 1.8% per year. In government they grew at half that rate. From 2001 to 2011 government jobs grew at 0.4% per year -- less than half the rate of the previous three decades.
- If government jobs had grown 2001-2011 at the same rate as government job growth 1970-2001, then the US would presently have 1 million more jobs. The current unemployment rate would be 6.4% rather than 7.0%.
- If government jobs had grown 2001-2011 at the same rate as overall growth of jobs in the US economy 1970-2001, then the US would presently have 3.03 million more jobs. The current unemployment rate would be 5.1%.
What could the US government do with 3 million more employees? Oh, I'm sure we could think of something.