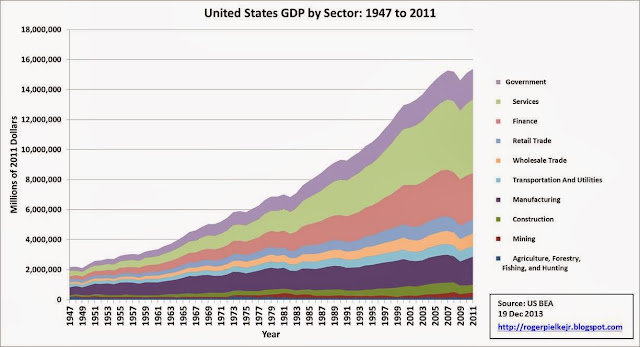
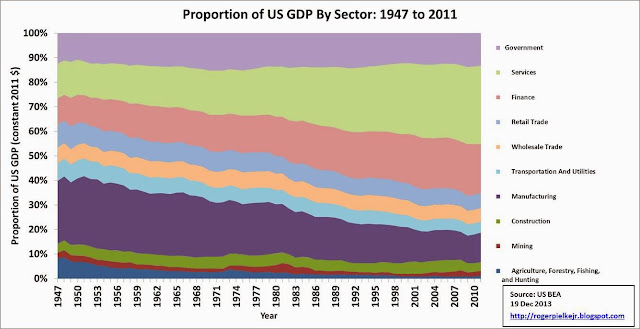
December 19, 2013 Graphs of the Day: US GDP 1947-2011 Total US GDP in constant 2011 dollars. Proportion of GDP by sector. Government in 1960: 13.2%; in 2011: 13.2% Agriculture & manufacturing in 1950: 34%; in 2011: 13% Finance & services in 1950: 26%; in 2011: 52% Data source: US BEA ← Back to archive