November 22, 2013
Graphs of the Day: Major US Hurricane Drought Continues
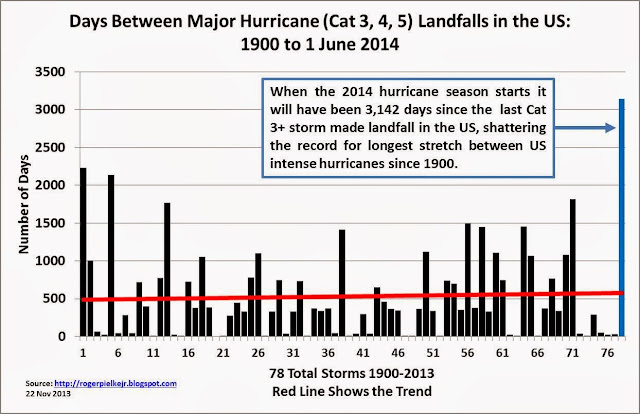
The US good luck with respect to hurricane landfalls -- yes, good luck -- continues. The graph below shows total US hurricane landfalls 1900 through 2013.
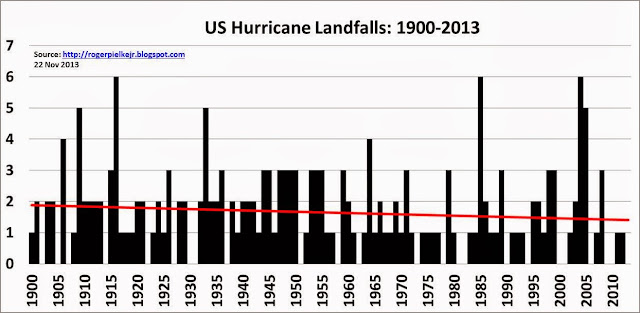
The red line in the graph above shows a decrease in the number of US landfalls of more than 25% since (which given variability, may just be an artifact and not reflecting a secular change). There is no evidence to support more or more intense US hurricanes. The data actually suggests much the opposite.
If you are interested in a global perspective, Ryan Maue keeps excellent data. Here is his latest graph on global ACE (accumulated cyclone energy, an overall measure of storm intensity).
To date 2013 is at 73% of the global average and the North Atlantic is at 30%. We'll post up our updated data for global landfalls through 2013 before the end of the calendar year.