August 10, 2012
Graphs of the Day: Why is Corn so Expensive?
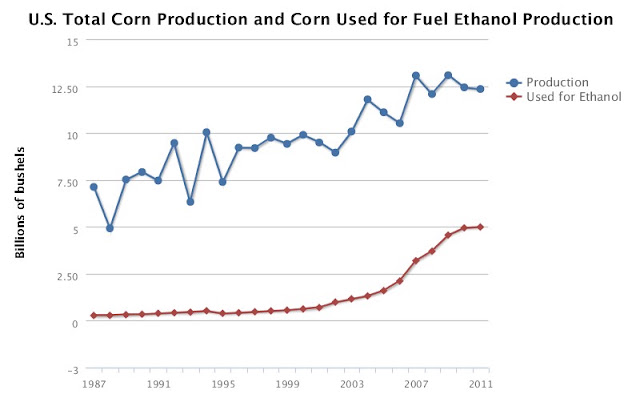
The graph above comes from USDA data displayed on this DOE website. It shows US corn production and also the amount devoted to ethanol production. USDA currently forecasts 2012 corn production at 10.8 billion bushels, the lowest since 2006.Purdue/NFF study says reduce mandated ethanol production by 45% and corn prices drop 23-28%, from Table 2 in the study: farmfoundation.org/news/articlefi…
— Roger Pielke Jr. (@RogerPielkeJr) August 17, 2012
However, due to government polciies increasing amounts of corn are diverted to ethanol production. The graph below simply shows the difference between the two curves above.
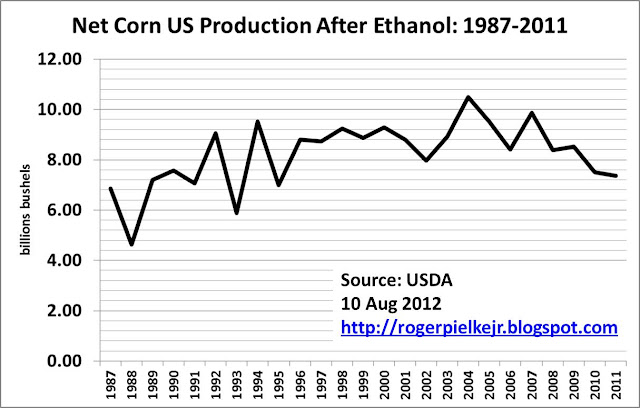
Why is corn so expensive? The answer does not seem difficult to understand.