April 6, 2009
US GDP vs. Carbon Dioxide Emissions 1949-2007
[UPDATED]
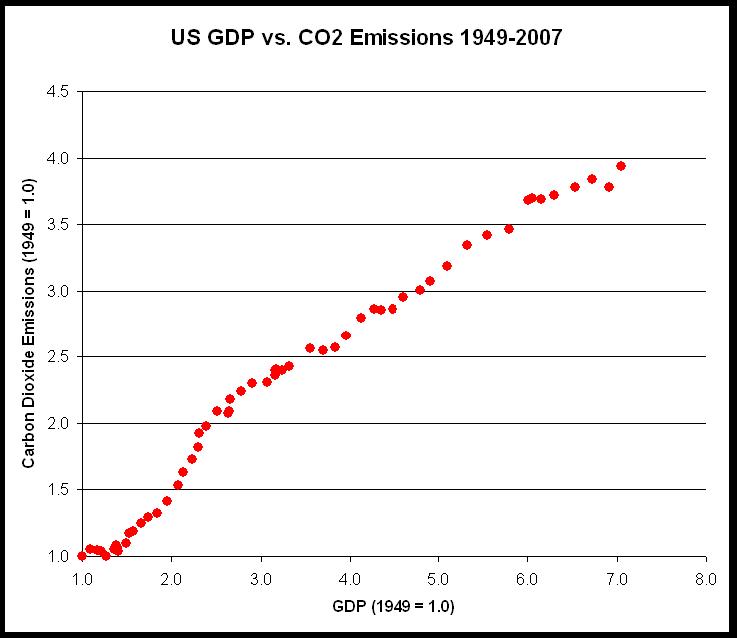
In the United States, how tightly is economic growth coupled to carbon dioxide emissions? The following graph shows US GDP and commercial carbon dioxide emissions (both set to 1.0 in 1949) for the period 1949-2007. You can see that the US economy has progressively decarbonized, meaning that it has seen progressively less commercial carbon dioxide emissions per unit of GDP, but at the same time, the relationship of GDP and emissions remains very, very close. (Note: Emissions data from EIA and GDP data from BEA.)
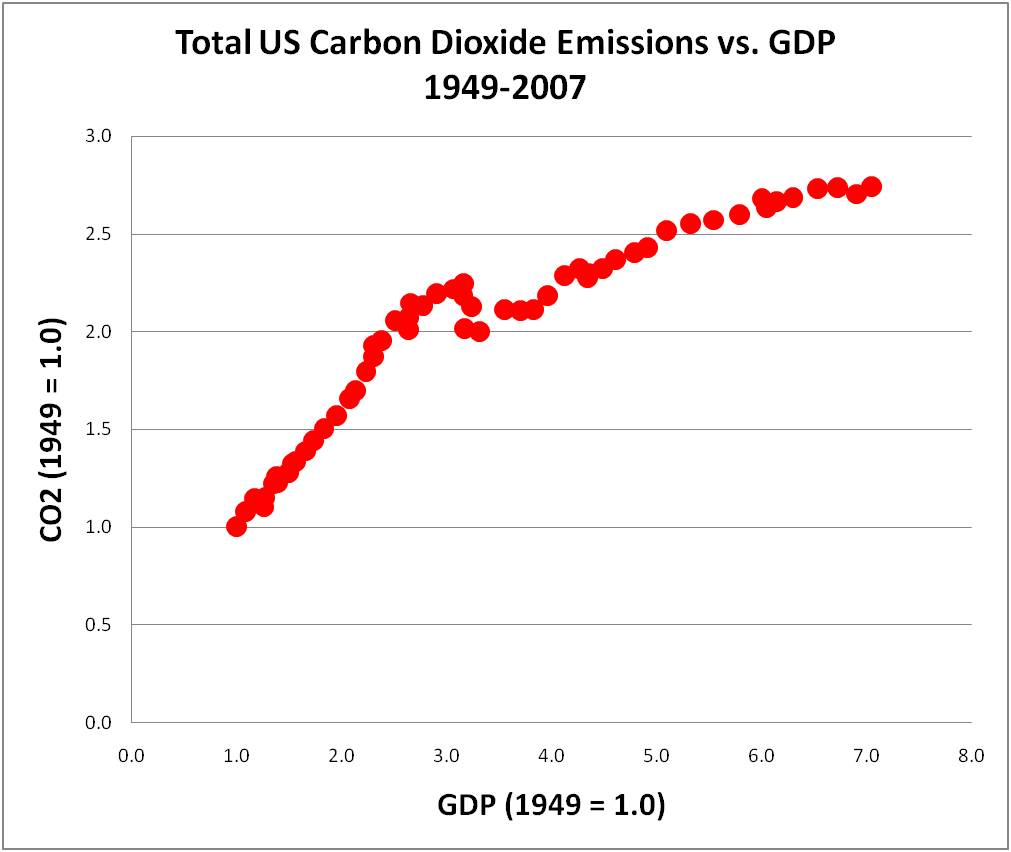
Below is a graph showing total U.S. carbon dioxide emissions versus GDP for the same time period.
 <
<