March 6, 2009
Doing the Math
In his speech earlier this week U.S. chief climate negotiator Todd Stern said:
[W]e must be willing to follow the numbers wherever they lead
And admonished us to “do the math.” So lets do some math.
Yesterday, before the House Subcommittee on Energy and Mineral Resources Howard Gruenspecht, acting administrator of the US Energy Information Agency, testified, and presented a preview of the numbers that will appear in the 2009 EIA Annual Eenergy outlook (testimony here in PDF). From these numbers I have calculated the implications of the EIA business as usual scenario (which includes polcies now in place) for carbon intensity of total primary energy use, which is shown by the blue curve below. I have also graphed the implications of a plan to reduce emissions 15% below 2005 levels (as proposed by the Obama Administration) for carbon intensity of primary energy use shown by the brown curve. The brown curve assumes that energy use will increase as projected in the BAU scenario, though this is of course a variable.
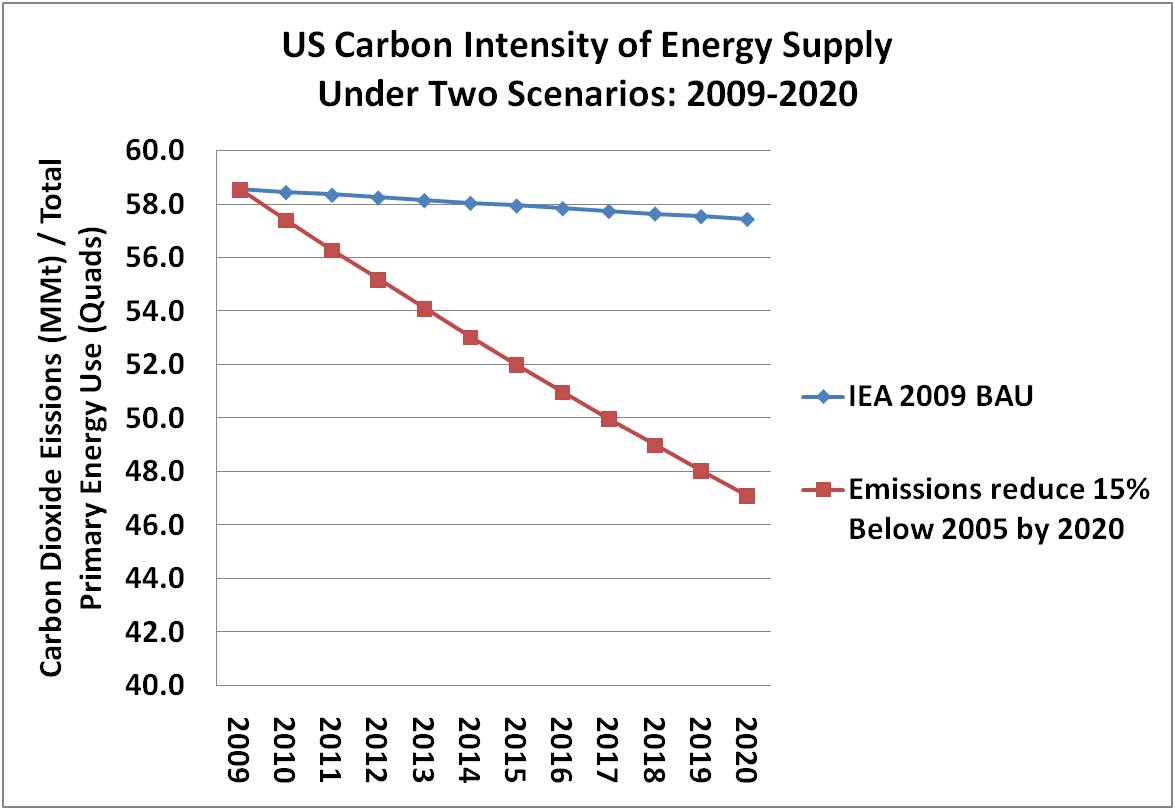
For anyone interested in actually doing the math, here is your challenge:
Describe how the US is going to achieve a rate of decarbonization of total energy use as shown in the graph through a combination of (a) reduction in energy use, and (b) carbon free energy supply. Please explain not just the numbers, but the actions that will lead to the numbers. The starting numbers from EIA BAU are as follows:
Total energy use (quads)
2009 102.9
2020 108.4
Renewable + Nuclear energy supply (percentage)
2009 15.4%
2020 19.4%
Carbon dioxide emissions (MMt)
2009 6,023
2020 6,225
2020 Target of 15% below 2005 levels (MMt CO2)
5,095
Please show your work!