May 15, 2008
Comparing Distrubutions of Observations and Predictions: A Response to James Annan
James Annan, a climate modeler, has written a post at his blog trying to explain why it is inconceivable that recent observations of global average temperature trends can be considered to be inconsistent with predictions from the models of the IPCC. James has an increasing snarky, angry tone to his comments which I will ignore in favor of the math (and I’d ask those offering comments on our blog to also be respectful, even if that respect is not returned), and in this post I will explain that even using his approach, there remains a quantitative justification for arguing that recent trends are inconsistent with IPCC projections.
James asks:
Are the models consistent with the observations over the last 8 years?
He answers this question using a standard approach to comparing means from two distributions, a test that I have openly questioned its appropriateness in this context. But lets grant James this methodological point for this discussion.
James defines the past 8 years as the past 8 calendar years, 2000-2007, which we will see is a significant decision. As reported to us by his fellow modelers at Real Climate, James presents the distribution of models as having a mean 8-year trend of 0.19 degrees per decade, with a standard deviation of 0.21. So lets also accept this starting point.
In a post on 8-year trends in observational data Real Climate reported the standard deviation of these trends to be 0.19. (Note this is based on NASA data, and I would be happy to use a different value if a good argument can be made to do so.) I calculated the least-squares best fit line for the monthly data 2000-2007 from the UKMET dataset that James pointed to and arrived at 0.10 degrees/C per decade (James gets 0.11).
So lets take a look at how the distribution of 8-year trends in the models [N(0.19, 0.21)] compares to the analogous 8-year trend in the observations [N(0.10, 0.19)]. This is shown in the following graph with the model distribution in dark blue, and the observations in red.
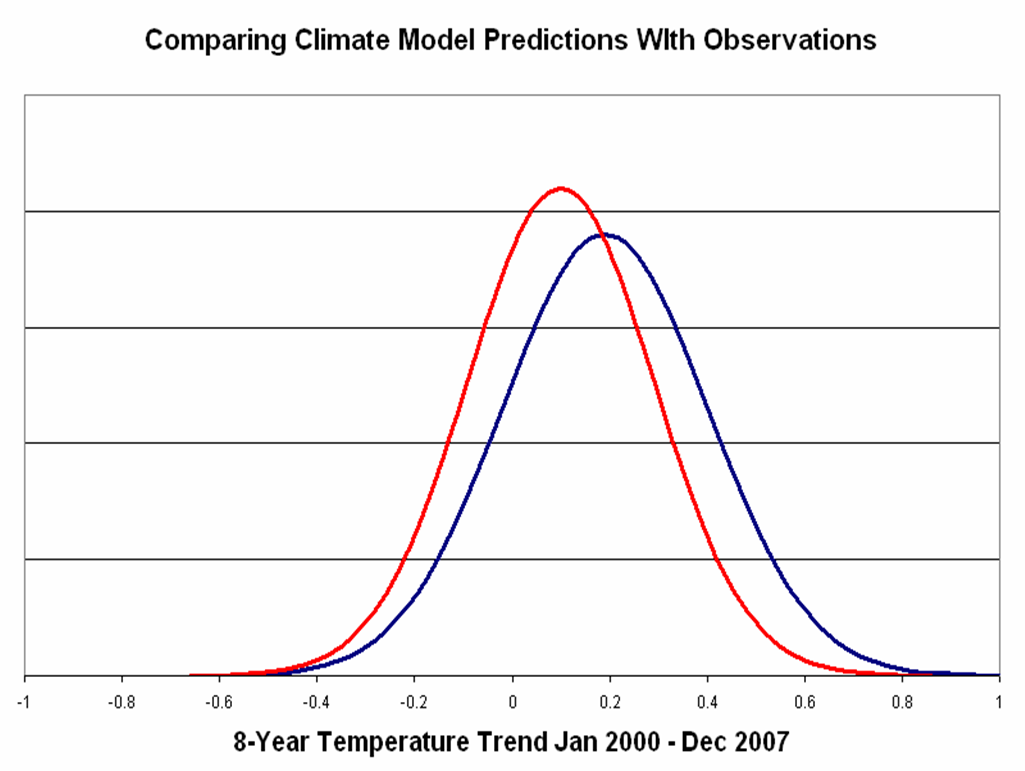
Guess what? Using this approach James is absolutely correct when he says that it would be incorrect to claim that the temperatures observed from 2000-2007 are inconsistent with the IPCC AR4 model predictions. In more direct language, any reasonable analysis would conclude that the observed and modeled temperature trends are consistent.
But now lets take a look at two different periods, first the past eight years of available data, so April 2000 to March 2008 (I understand that April 2008 values are just out and the anomaly is something like half the value of April 2000, so making this update would make a small difference).
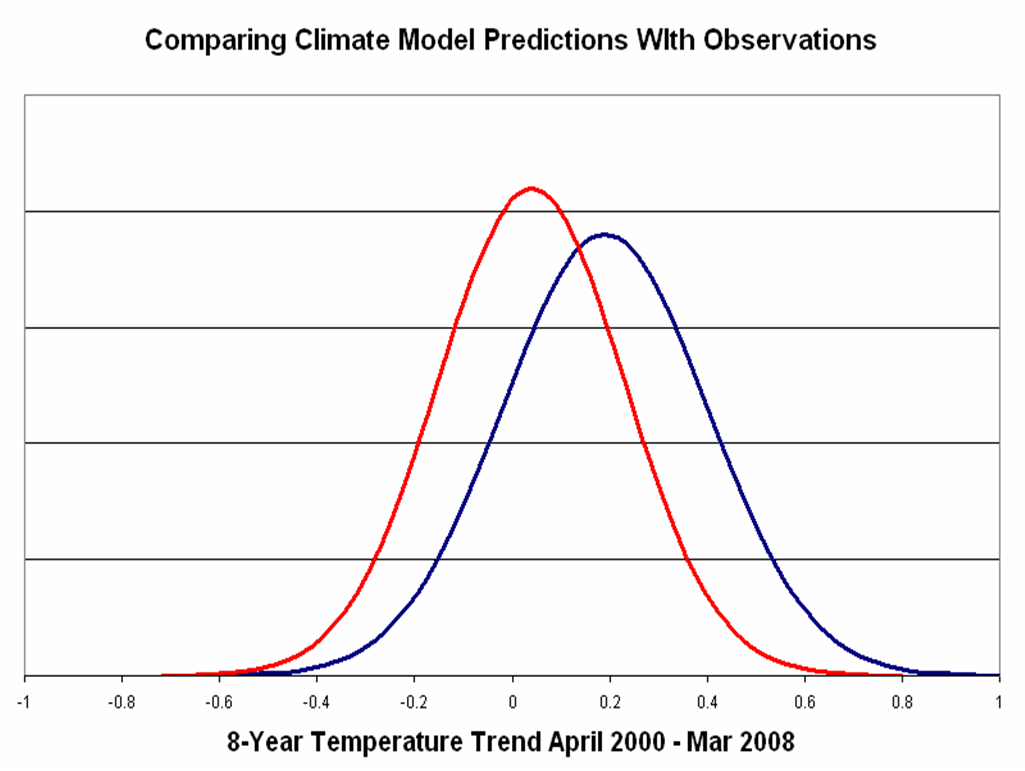
You can clearly see that the amount of overlap between the distributions is smaller than in the first figure above. If one wanted to claim that this amount of overlap demonstrates consistency between models and observations I would not disagree. But at the same time, there is also a case to be made that the distributions are inconsistent, as the amount of overlap is not insignificant. There would be an even stronger case to be made for inconsistency using the satellite data, which shows a smaller trend over this same period.
But now lets take a look at the period January 2001 to present, shown below.
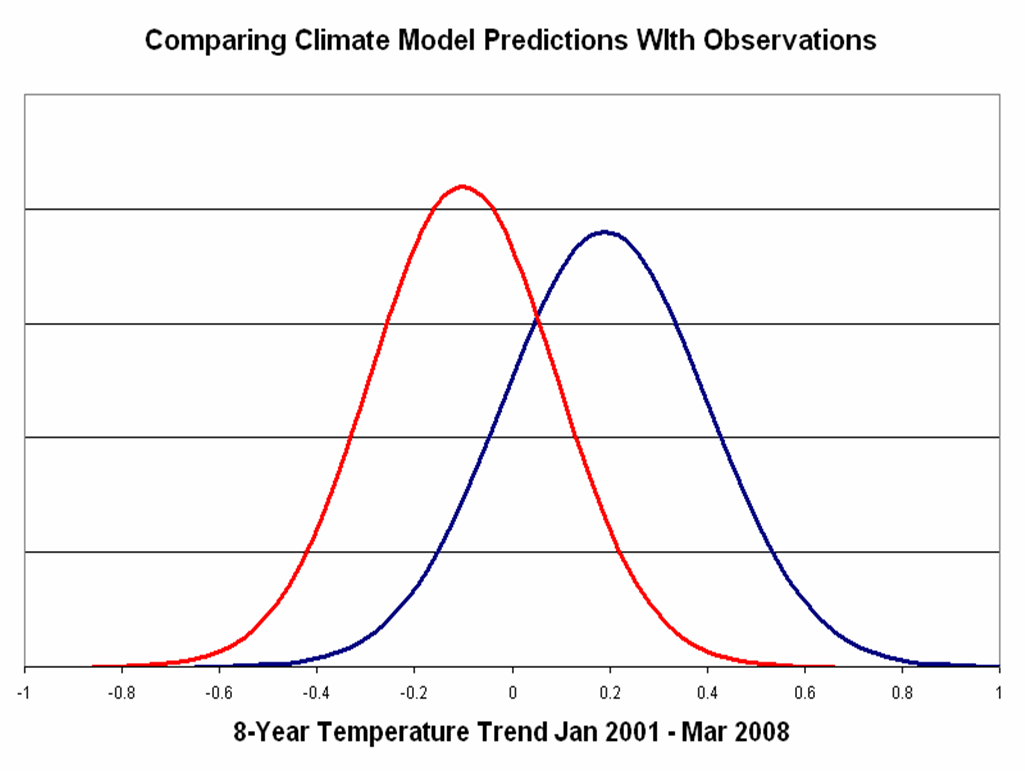
Clearly, there is a strong argument to be made that these distributions are inconsistent with one another (and again, even stronger with the satellite data).
So lets summarize. I have engaged these exercises to approach the question: “What observations of the climate system would be inconsistent with predictions of IPCC AR4?”
1. Using the example of global average temperatures to illustrate how this answer might be approached, I have concluded that it is not “bogus” or “denialist” (as some prominent climate modelers have suggested) to either ask the question or to suggest that there is some valid evidence indicating inconsistency between observations and model predictions.
2. The proper way to approach this question is not clear. With climate models we are not dealing with balls and urns, as in idealized situations of hypothesis testing. Consider that the greater the uncertainty in climate models — which results from any research that expands the realization space — will increase the consistency between observations and models, if consistency is simply defined as some part of the distribution of observations overlapping with the distribution of forecasts. Thus, defining a distribution of model predictions simply as being equivalent to the distribution of realizations is problematic, especially if model predictions are expected to have practical value.
3. Some people get very angry when these issues are raised. Readers should see the reactions to my posts as an obvious example of how the politics of climate change are reflected in pressures not to ask these sort of questions.
One solution to this situation would be to ask those who issue climate predictions for the purposes of informing decision makers — on any time scale — to clearly explain at the time the prediction is issued what data are being predicted and what values of those data would falsify the prediction. Otherwise, we will find ourselves in a situation where the instinctive response of those issuing the predictions will be to defend their forecasts as being consistent with the observations, no matter what is observed.