May 12, 2008
How to Make Two Decades of Cooling Consistent with Warming
The folks at Real Climate have produced a very interesting analysis that provides some useful information for the task of framing a falsification exercise on IPCC predictions of global surface temperature changes. The exercise also provides some insight into how this branch of the climate science community defines the concept of consistency between models and observations, and why it is that every observation seems to be, in their eyes, “consistent with” model predictions. This post explains why Real Climate is wrong in their conclusions on falsification and the why it is that two decades of cooling can be defined as “consistent with” predictions of warming.
In their post, RealClimate concludes:
Claims that a negative observed trend over the last 8 years would be inconsistent with the models cannot be supported. Similar claims that the IPCC projection of about 0.2ºC/dec over the next few decades would be falsified with such an observation are equally bogus.
Real Climate defines observations to be “consistent with” the models to mean that an observation, with its corresponding uncertainty range, overlaps with the spread of the entire ensemble of model realizations. This is the exact same definition of “consistent with” that I have criticized here on many occasions. Why? Because it means that the greater the uncertainty in modeling — that is, the greater the spread in outcomes across model realizations — the more likely that observations will be “consistent with” the models. More models, more outcomes, greater consistency – but less certainty. It is in this way that pretty much any observation becomes “consistent with” the models.
As we will see below, the assertion by Real Climate that “a negative observed trend over the last 8 years would be inconsistent with the models cannot be supported” is simply wrong. Real Climate is more on the mark when they write:
Over a twenty year period, you would be on stronger ground in arguing that a negative trend would be outside the 95% confidence limits of the expected trend (the one model run in the above ensemble suggests that would only happen ~2% of the time).
Most people seeking to examine the consistency between models and observations would use some sort of probabilistic threshold, like a 95% confidence interval, which would in this case be calculated as a joint probability of observations and models.
So let’s go through the exercise of comparing modeled and observed trends to illustrate why Real Climate is wrong, or more generously, has adopted a definition of “consistent with” that is so broad as to be meaningless in practice.
First the observations. Thanks to Lucia Liljegren we have the observed trends in global surface temperature 2001-present (which slightly less than 8 years), with 95% confidence intervals, for five groups that keep such record. Here is that information she has presented in degrees Celsius per decade:
UKMET -1.3 +/- 1.8
NOAA 0.0 +/- 1.6
RSS -1.5 +/- 2.2
UAH -0.9 +/- 2.8
GISS 0.2 +/- 2.1
Real Climate very usefully presents 8-year trends for 55 model realizations in a figure that is reproduced below. I have annotated the graph by showing the 95% range for the model realizations, which corresponds to excluding the most extreme 3 model realization on either end of the distribution (2.75 to be exact). (I have emailed Gavin Schmidt asking for the data, which would enable a bit more precision. ) The blue horizontal line at the bottom labeled “95% spread across model realizations” shows the 95% range of 8-year trends present across the IPCC model realizations.
I have also annotated the figure to show in purple the 8+ year trends from the five groups that track global surface temperatures, with the 95% range as calculated by Lucia Liljegren. I have presented each of the individual ranges for the 5 groups, and then with a single purple horizontal line the range across the five observational groups.
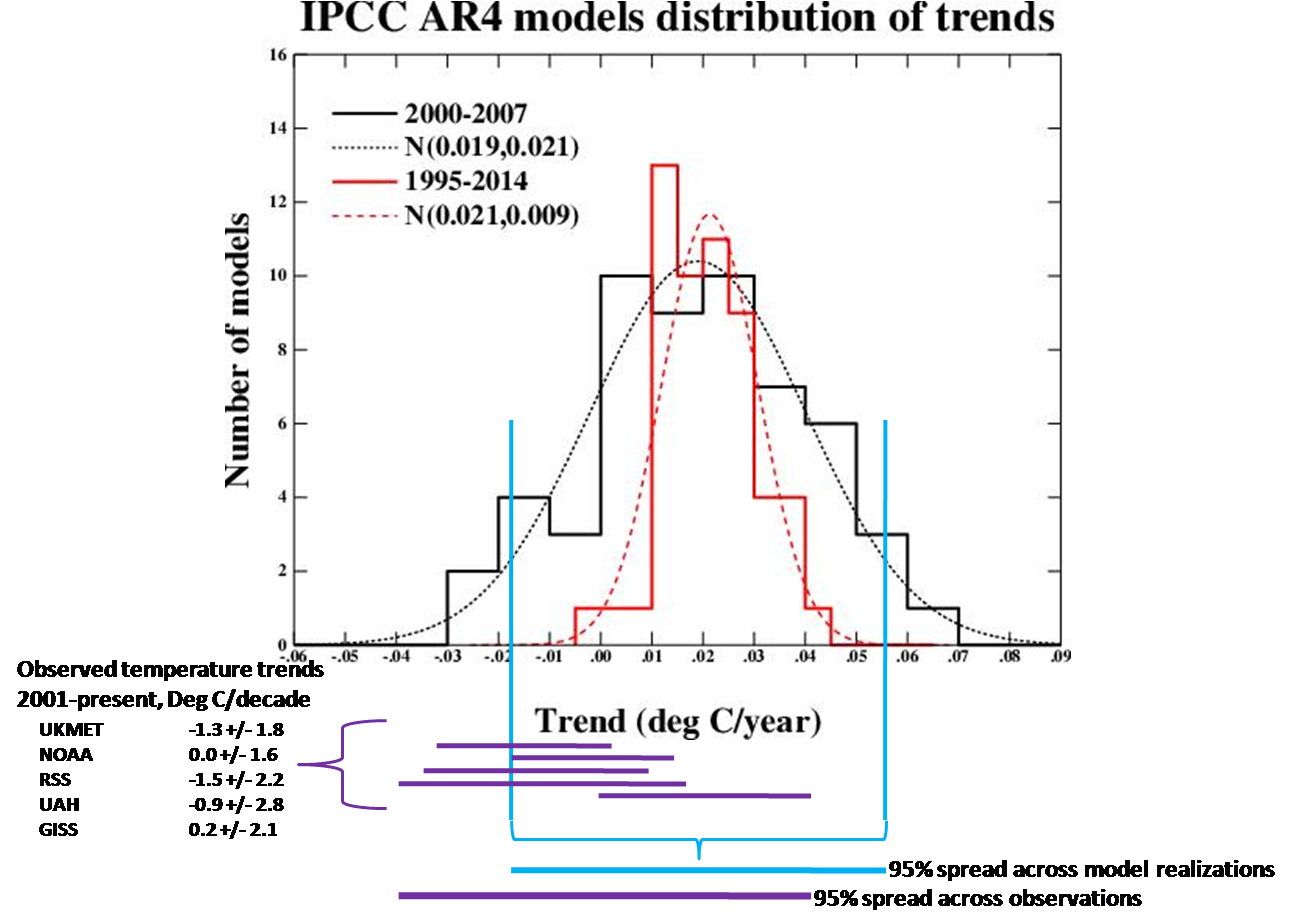
Quite clearly there is a large portion of the spread in the observations that is not encompassed by the spread in the models. This part of the observations is cooler than the range provided by the models. And this then leads us to the question of how to interpret the lack of complete overlap.
One interpretation, and the one that makes the most sense to me, is that because there is not an overlap between modeled and observed trends at the 95% level (which is fairly obvious from the figure, but could be easily calculated with the original data) then one could properly claim that the surface temperature observations 2001-present fail to demonstrate consistency with the models of IPCC AR4 at the 95% level. They do however show consistency at some lower level of confidence. Taking each observational dataset independently, one would conclude that UKMET, RSS, and UAH are inconsistent with the models, whereas NASA and NOAA are consistent with them, again at a 95% threshold.
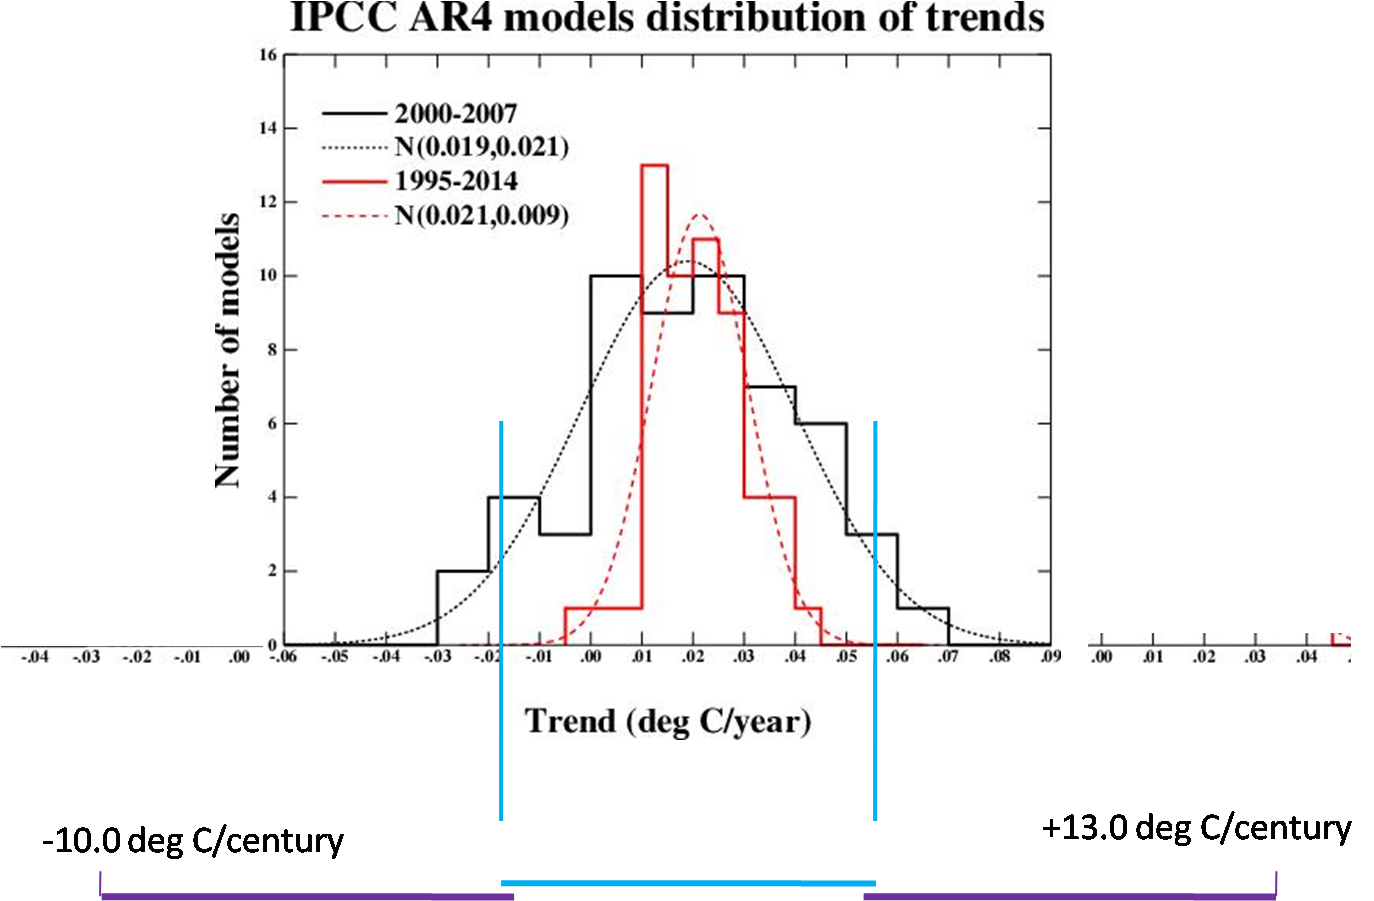
Another interpretation, apparently favored by the guys at Real Climate, is that because there is some overlap between the 95% ranges (i.e., overlap between the blue and purple lines), the models and observations are in fact consistent with one another. [UPDATE: Gave Schmidt at RC confirms this interpretation when he writes in response to a question about the possibility of falsifying IPCC predictions: "Sure. Data that falls unambiguously outside it [i.e., the model range].”] But this type of test for consistency is extremely weak. The Figure below takes the 95% spread in the observations and illustrates how far above and below the 95% spread in the models some overlap would allow. If the test of “consistent with” is defined as any overlap between models and observations, then any rate of cooling or warming between -10 deg C/decade and +13.0 dec C/decade could be said to be “consistent with” the model predictions of the IPCC. This is clearly so absurd as to be meaningless.
So when Real Climate concludes that . . .
Claims that a negative observed trend over the last 8 years would be inconsistent with the models cannot be supported
. . . they are simply incorrect by any reasonable definition of consistency based on probabilistic reasoning. Such claims do in fact have ample support.
If they wish to assert than any overlap between uncertainties in observed temperature trends and the spread of model realizations over an 8-year period implies consistency, then they are arguing that any 8-year trend between -10/C and +13/C (per century) would be consistent with the models. This sort of reasoning turns climate model falsification into a rather meaningless exercise. [UPDATE: In the comments, climate modeler James Annan makes exactly this argument, but goes even further: "even if the model and obs ranges didn't overlap at all, they might (just) be consistent".
Of course in practice the tactical response to claims that observations falsify model predictions will be to argue for expanding the range of realizations in the models, and arguing for reducing the range of uncertainties in the observations. This is one reason why debates over the predictions of climate models devolve into philosophical discussions about how to treat uncertainties.
Finally, how then should we interpret Keenlyside et al.? It is, as Real Climate admits, outside the 95% range of the IPCC AR4 models for its prediction of trends to 2015. But wait, Keelyside et al. in fact use one of the models of the IPCC AR4 runs, and thus this fact could be used to argue that the range of possible 20-year trends is actually larger than that presented by the IPCC. If interpreted in this way, then this would get us back to the interesting conclusion that more models, initialized in different ways, actually work to expand the range of possible futures. Thus we should not be surprised to see Real Climate conclude
Similar claims that the IPCC projection of about 0.2ºC/dec over the next few decades would be falsified with such an observation [of "a negative observed trend"] are equally bogus.
And this gentle readers is exactly why I explained in a recent post that Keelyside et al. now means that a two-decade cooling trend (in RC parlance, a “negative observed trend over 20 years”) is now defined as consistent with predictions of warming.