December 28, 2006
Draft Paper for Comment: Decreased Proportion of Tropical Cyclone Landfalls in the United States
Below you will find a short, draft paper on the decreasing proportion of U.S. hurricane landfalls to total North Atlantic hurricanes from 1851-2006 that I will soon submit for publication in a peer-reviewed journal. I am not worried about pre-publication on the web and the policies of the big journals as Nature has already declined to send it out for review, suggesting that the specialty journals are a more appropriate venue. I have shared earlier versions of the paper with a range of different scientists inside (and outside of) the tropical cyclone research community, and I thank those who have so far responded for their helpful suggestions. I welcome any comments readers here may have as well.
Decreased Proportions of Tropical Cyclone Landfalls in the United States: Data Artifact, Blind Luck, Natural Variability, and/or Global Warming?
Roger A. Pielke, Jr.
28 December 2006
DISCUSSION DRAFT
Introduction
This short note is motivated by several recent studies that examine Atlantic tropical cyclone statistics over the past century and a half finding a significant upward trend (Holland and Webster, 2007; Mann and Emanuel, 2006). Both studies attribute an observed increase in North Atlantic (NATL) tropical cyclone activity to anthropogenic causes. This paper uses a simple approach to examine trends in U.S. hurricane landfalls 1851-2006. The annual number of U.S. hurricane landfalls has remained remarkably constant over this period exhibiting no trend. However, out of the total NATL storm activity, the proportion of landfalling storms making landfall in the United States has exhibited a marked decrease. These trends raise important but heretofore largely unexamined research questions about tropical cyclone landfall theory, data, and analyses.
North Atlantic Tropical Cyclone Data
Two datasets in this analysis are kept by the U.S. National Oceanic and Atmospheric Administration. The first dataset includes all tropical cyclones of at least tropical storm strength (i.e., maximum winds >17 meters/second) in the NATL 1851-2006 (1). The second dataset includes all such storms that affected the U.S. coastline at hurricane strength (i.e., maximum winds of >33 meters/second) (2). It is widely accepted that the number of landfalling storms is among the most accurate metrics available for tropical cyclones in the Atlantic (Landsea 2005, Emanuel 2005).
Issues about data quality are at the center of a vigorous and scientifically productive debate within the tropical cyclone research community (e.g., Landsea et al. 2006, Kossin et al. in press). This paper proceeds under the same assumptions on data quality used by Holland and Webster (2007),
Before 1945 the overall statistic of total tropical cyclones numbers contains useful information . . . In summary, we consider that the veracity of the NATL tropical storm data base is sufficient to enable the broad brush analysis that we undertake in this study. Prior to 1945 we concentrate on the total number of tropical cyclones, irrespective of intensity.
And also Mann and Emanuel (2006),
A reasonably reliable record of annual North Atlantic tropical cyclone counts is thus available back into the late nineteenth century.
The point here is not that these conclusions about data quality are necessarily correct, but to argue that if one accepts the analyses in these studies predicated on the fidelity of long-term counts of NATL tropical cyclones, then it follows logically that one also has to accept the analysis presented here using the exact same data.
Analysis
Figure 1 shows the total number of United States hurricane landfalls 1851-2006.
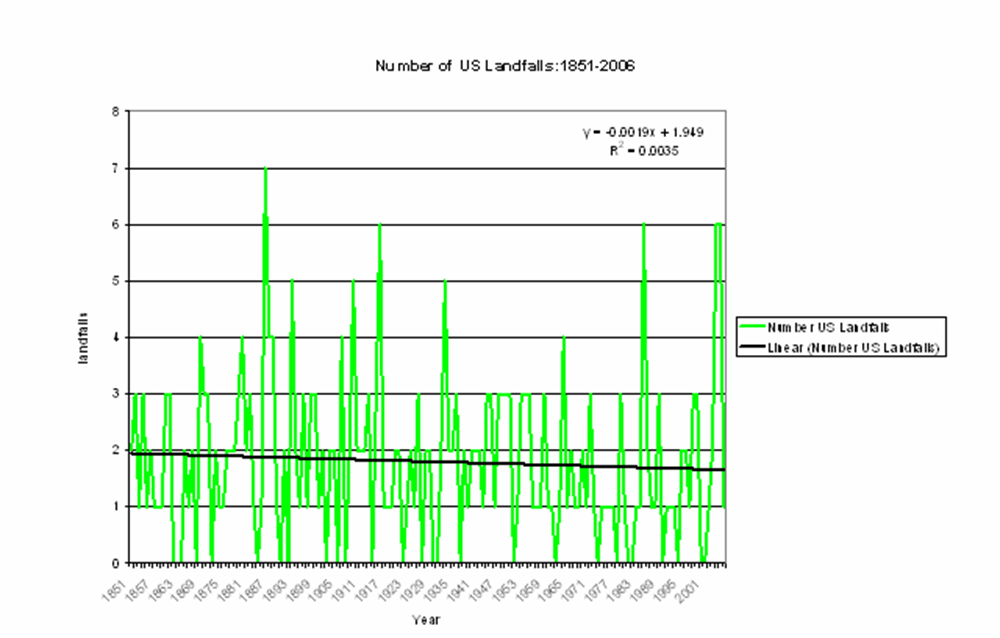
There is no trend in the data. This finding is generally accepted, and is supported by the lack of trend in normalized U.S. hurricane damage over the past century (Pielke, et al. under review). Figure 2 shows the percentage of total storms that affected the United States as hurricanes from 1851-2006 (3).
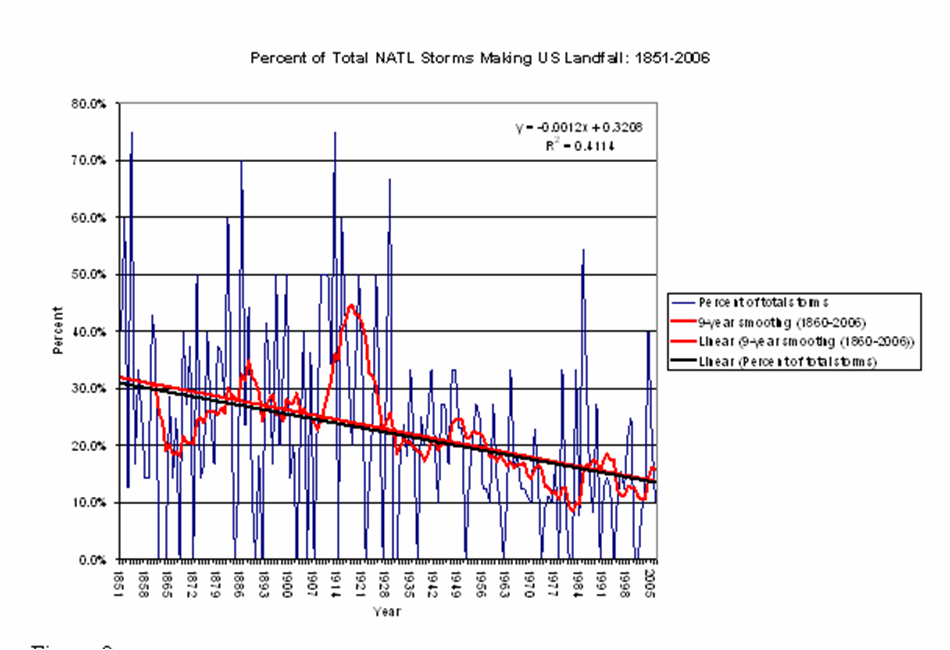
There is a decrease in the proportion of storms striking the United States from any starting point prior to about 1970. This decrease increases in statistical significance as the record is extended further into the past. A linear trend line is presented on the graph for both the raw data and the 9-year moving average (4). Apparent in Figure 2 starting in 1944, which is considered to be the most accurate data period in the Atlantic (Neumann et al. 1999, Landsea et al. 1999), is a decrease in the proportion of storms striking the coast over this time period as well (statistics discussed below). Holland and Webster (2007) identify three climatic regimes, 1905-1930, 1931-1994, and 1995-2005. The proportion of landfalling storms for each of the three eras indicates a steady decline, respectively at 31.8%, 17.0%, and 14.6%.
Figure 3 shows for 1950-2006 the relationship of the percentage of landfalling storms and NATL August-September-October (ASO) sea surface temperatures (5).
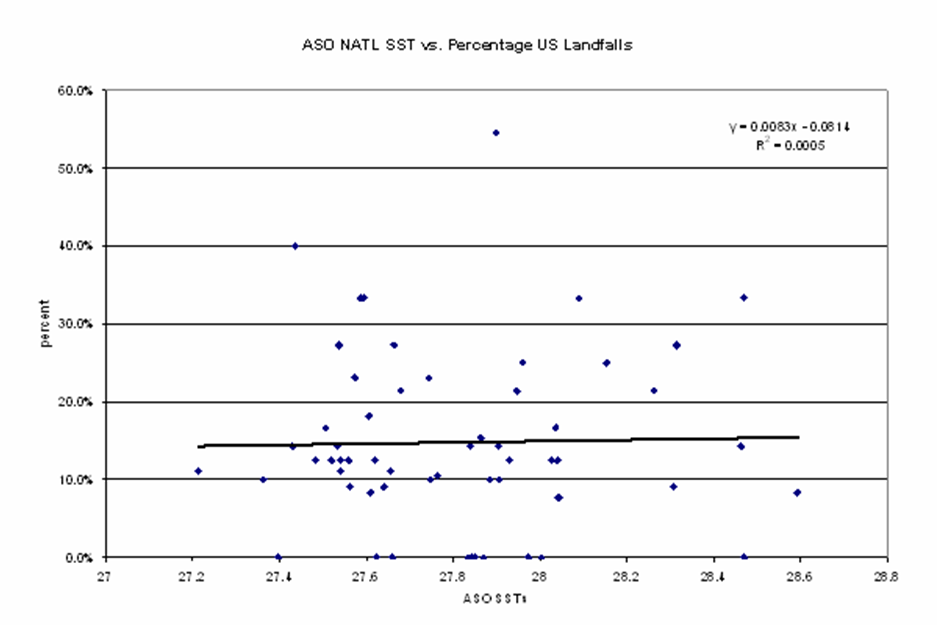
On this time scale at least there is no significant relationship, though perhaps a more comprehensive statistical analysis that goes beyond the present focus may yet reveal a relationship (cf. Jagger et al. 2007).
Discussion
The data presented here suggests some interesting possibilities which cannot be resolved based on the data presented here.
First, it is possible that the decreasing trend in U.S. landfalls as a percentage of total storms is a statistical artifact resulting from an undercount of historical storms. The number of landfalling storms is certainly known with much higher certainty than the total number of storms. Thus, an undercount of the total number of storms would artificially increase landfalling storms as a percentage of total storms. This first interpretation is consistent with a view that the NATL record is most accurate since 1970, and that inaccuracies exist prior to that time. This view on data quality would also be inconsistent with those who argue that the NATL record is complete since 1944 (cf. Landsea et al. 1999). If the decreasing trend is an artifact of the datasets, then it would obviously call into question any analysis of trends based on the total number of storms over thuis time period.
Second, it is possible that the decreasing trend in U.S. landfalls as a percentage of total storms is (at least in part) a reflection of the actual behavior of the climate system. That is, if one accepts the trends reported by Holland and Webster (2007) and Mann and Emanuel (2006), then logically, it follows that one also has to accept the trends reported here. In this case, if NATL tropical cyclone activity has indeed increased, then there has also been a significant decrease in the proportion of storms that strike the U.S. coast.
Under this second possibility there is then the question of attribution. Figure 3 indicates that, at least since 1950, there is in fact no obvious relationship between NATL ASO SST and the proportion of total storms that make landfall. Given this finding, if SSTs are indeed the principle factor explaining increasing tropical cyclone activity, as some studies have suggested (e.g., Holland and Webster (2007), Mann and Emanuel (2006), Hoyos et al. (2006)) and SSTs are largely forced by greenhouse gases (Santer et al. 2006), then it follows that explaining the decreasing proportion of landfalling storms requires further investigations of climate processes beyond trends in SSTs. In other words, if global warming is increasing the incidence of NATL tropical cyclones, then the same dataset that indicates this result also suggests that global warming, and/or some other factors, are acting to diminish the proportion of total storms that strike the United States.
Emanuel (2005) raises the possibility that simple randomness might explain the lack of a trend in landfalling storm intensities in the presence of such a trend in the entire NATL. This may very well be the case (Pielke 2005); however, Emanuel’s point was made with respect to an integrated index of power dissipation, for which the landfalling component was only about 1% of the total NATL data. In the case of total storms, about 20% of the total storms make landfall over the entire dataset. It is therefore quite unlikely that randomness alone explains these results.
This conclusion is unavoidable if one accepts the results of Holland and Webster (2007) that “data errors cannot explain the sharp, high amplitude transitions between the climatic regimes in the North Atlantic, each with an increase of around 50% in cyclone and hurricane numbers.” With an increase of 50% in total hurricane numbers in two transitions among three climate regimes, and landfalling storms representing approximately 20% of the long-term total, it is statistically improbable that these changes would not manifest themselves in increased landfalls, all else being equal. Consider that that 31.8% of all storms that made landfall during 1905-1930 (Holland and Webster’s first NATL TC climate regime). Under a binomial distribution the probability of subsequently observing 131 or fewer landfalls out of 788 in the period 1931-2006 (i.e., the actual observations) at the earlier period’s probability of landfall is less than 0.00001. Thus, it necessarily must be true that either the data is flawed or there are real changes in the landfall characteristics of NATL climatology.
More recently, from 1944 to 1974 17.9% (31 years, 55/307) of total NATL storms made landfall in the U.S., and from 1975-2006 (31 years, 51/360) 14.2% of total NATL storms made landfall in the U.S.. The probability of observing 51 or less landfalls in the second period at the earlier period’s landfall rate is 0.054. Thus, there is reason to believe that even in the most recent half century where storm counts have been assumed to be most accurate there are either data problems or real changes have occurred in the climatology of NATL tropical cyclone landfalls.
Conclusion
This short note has revisited trends in U.S. landfalling hurricanes both as annual totals and as a proportion of total North Atlantic tropical cyclone activity from 1851-2006. The data indicate that there are no trends in landfall numbers but a marked decrease in the proportion of storms that make landfall. There are several possibilities for this decrease.
•One explanation is that earlier data fails to accurately represent the total actual number of tropical cyclones, thereby artificially increasing landfalling storms as a proportion of the total.
•A second explanation is that the trends in the total number of storms are in fact reflective of increasing Atlantic activity and the decreasing proportion that make landfall results from some yet unknown climate process that may or may not have a relationship to human activity. There is no obvious relationship between SSTs and landfall proportions.
•A third possibility, that the remarkable stability of landfall numbers over time is due to randomness, is highly unlikely simply for basic reasons of probability if one assumes that landfall proportions are constant over the long run.
Scientists are nonetheless in agreement that the coming decades will see landfall numbers that exceed the average from 1970-1994. Decision makers should take care not to overlook the possibility that future landfall rates may exceed that observed in the historical record, whether due to global warming, randomness, natural causes, or some combination. A lack of knowledge about the future means that surprises should be expected. Given the importance of landfalling storms to decision makers, a concluding recommendation is that the research community should place even greater attention to the challenging and important scientific questions of hurricane landfall climatology.
Footnotes
1. http://www.aoml.noaa.gov/hrd/Storm_pages/Atl/ATLdate.dat
2. http://www.aoml.noaa.gov/hrd/hurdat/ushurrlist18512005-gt.txt See the NOAA WWW page for a discussion of “affected the U.S. coastline.”
3. The use of a ratio based on total storms follows the similar use of a ratio by Holland and Webster (2007) to examine trends in storm intensity.
4. Note that a 9-year moving average is used simply because this is the smoothing used in Holland and Webster (2007).
5. NOAA’s Climate Prediction Center provides NATL SST indices by month from 1950 here: http://www.cpc.noaa.gov/data/indices/sstoi.atl.indices
References to be added