October 25, 2006
Atlantic SSTs vs, U.S. Hurricane Damage, Part 4
I am happy to report that after follow-up by Jim Elsner, I have been able to come close to replicating his results. However, the replication does not add much support to the hypothesis that Atlantic SSTs are related to normalized U.S. hurricane damage. Here is why.
First, in his paper (properly cited as Jagger et al., here in PDF) Elsner reports that their analysis was “able to explain 13% of the variation in the logarithm of loss values exceeding $100 mn using an ordinary least squares regression model.” Their analysis focused on insured losses and ours is on total losses. Their analysis is in 2000 US dollars and ours in 2005 US dollars. Because insured damages are roughly half the total economic losses, and inflation, wealth, population increase by about 5-7% per year, it makes sense to use a cut-off of $250 million for our dataset rather than $100 million – thanks to the reader who made this observation. (This has the effect of eliminating about 70% of the data, an important point which I will return to later, but for now we are simply replicating the earlier results). With the dataset parsed in this fashion we get the following results.
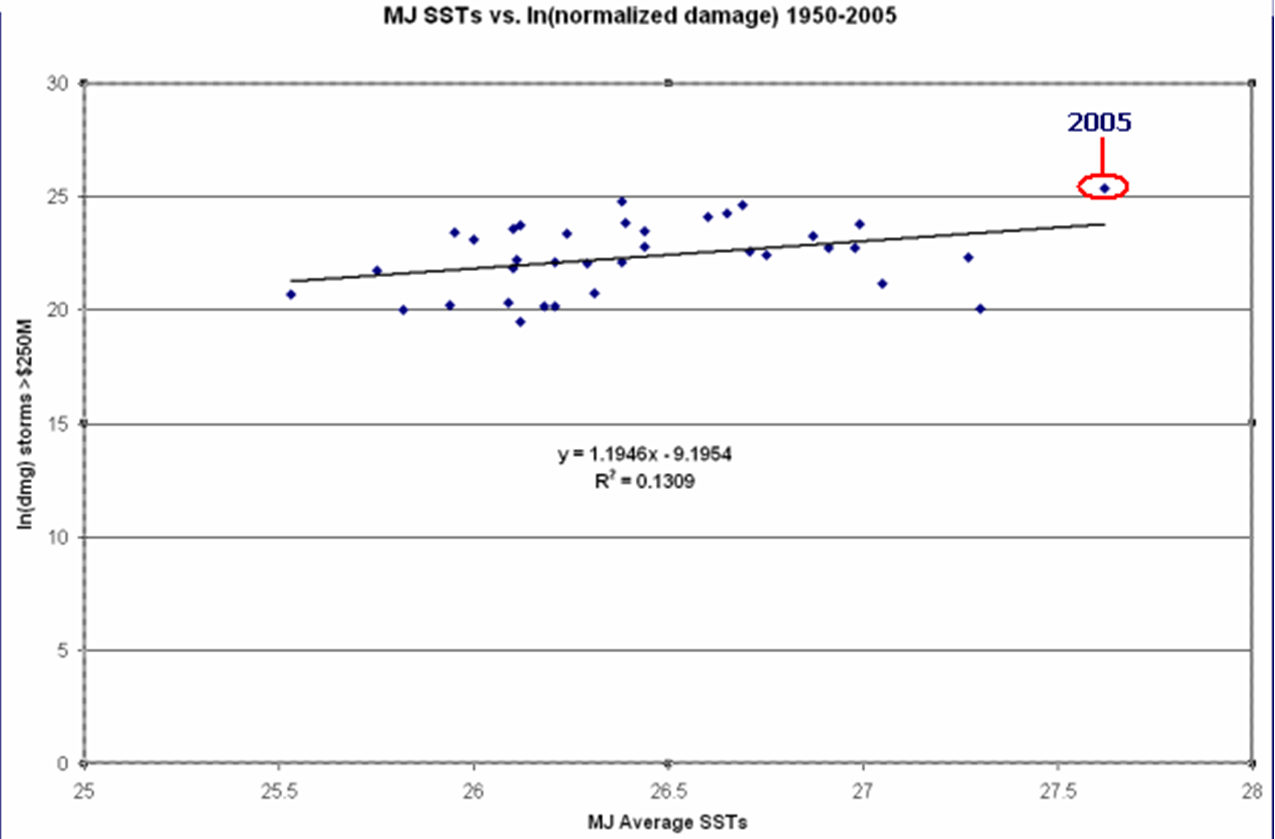
You can see that just as is reported in Jagger et al.’s paper, this result also shows an r^2 of 0.13 and I get a p value of 0.03, so the results are significant. I am satisfied that we have faithfully replicated his analysis! But what happens when one looks at the relationship from 1950-2004? The following graph shows this result.
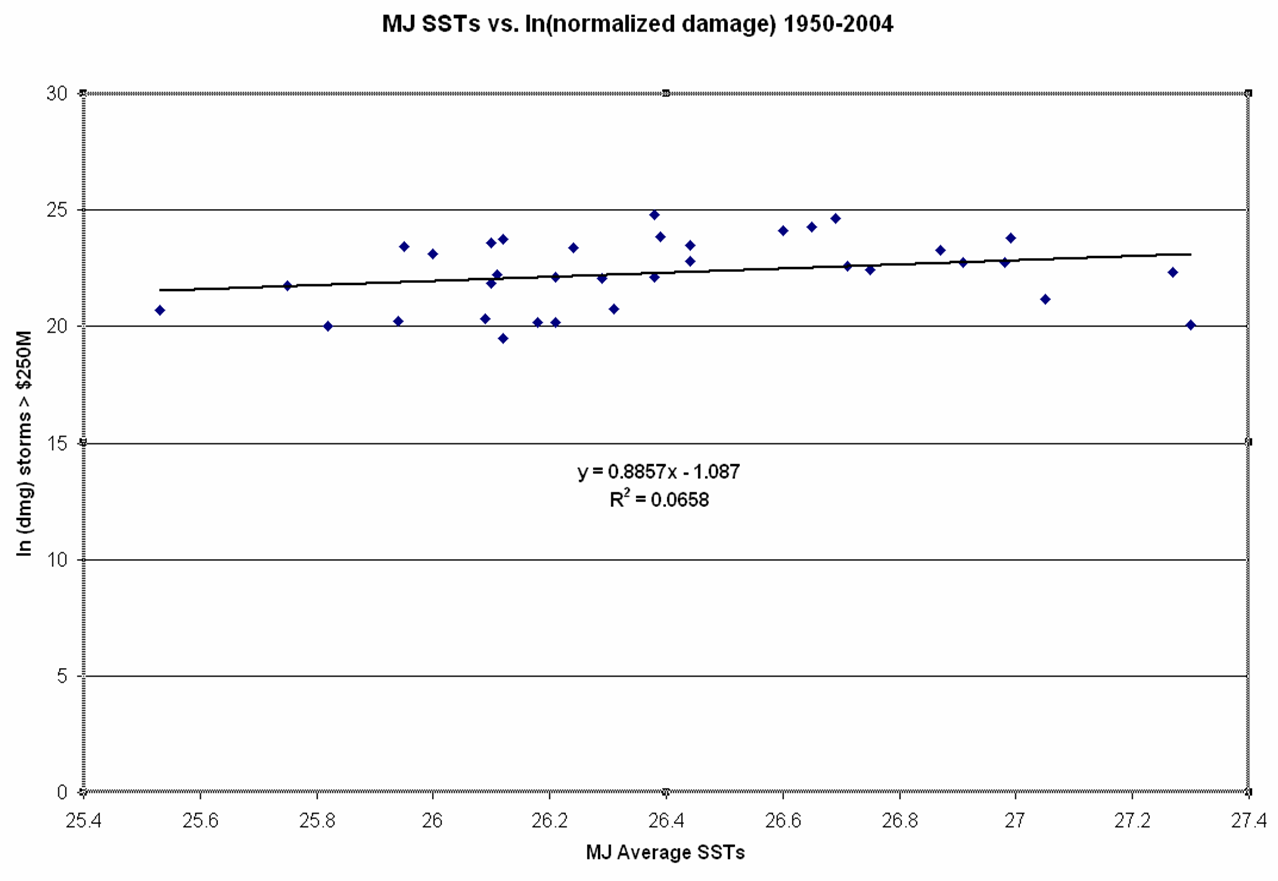
By removing 2005 the r^2 is cut in half and the p value goes up to 0.14, which is not statistically significant! So the results presented by Elsner are entirely a function of 2005, which was indeed an extreme year for both SSTs and damage. The question of whether 2005 is like seasons to come is a fair question, but I submit that the answer cannot be found in the historical data on SSTs and damage, not matter how one parses the data. Consider that if one adds 2006 to the results (damage = $250M, MJ SSTs = 26.88) the r^2 of the linear regression drops to 0.08, and the p value is 0.08, just outside statistical significance.
In short, there are a lot of ways to analyze data, and Elsner and colleagues approach is interesting. But in my view it does not provide much support for the hypothesis that SSTs are a useful or accurate predictor of damage. Anytime you have to remove 70% of the data to find a marginal (at best) relationship, it tells you that whatever relationship might exist cannot be that strong.
To underscore my perspective – future increases in Atlantic SSTs may indeed be accompanied by increases in normalized damages, but it is very difficult to accept this hypothesis based on the historical record of damage and SSTs, no matter how it is parsed. Thanks again to Jim for his continued involvement in these discussions.