September 9, 2005
Part II – Historical economic losses from hurricanes – Where does Katrina fit?
[Note: See the bottom of this post for links to further reading from the peer-reviewed literature]
In purely economic terms, Katrina is certain to be among the costliest disasters in history. As Part I of this series observed, understanding the magnitude of disaster losses is important for a wide range of decisions, including evaluating the effectiveness of disaster mitigation and understanding trends in vulnerability. This post describes the historical record of hurricane damages and seeks to place Katrina’s economic impact, at least given what is presently known, into historical context.
Current estimates for the losses associated with Katrina are in the range of $100-$150 billion. For reasons discussed below, this may be an oranges to apples comparison with the longer term historical record on hurricanes. But lets set this aside for the moment and use $125 billion as the total impact of Katrina. (read to the end for a discussion of why these estimates may not be a good comparison with past events.)
Katrina represents, by far, the single largest hurricane disaster in U.S. history. Based on data (PDF) available from the National Hurricane Center (NHC), here are the top 5 storms ranked by total damage in 2004 dollars:

1. Katrina $125B
2. Andrew $26.5B
3. Charlie $15B
4. Ivan $14.2B
5. Frances $8.9B
But frequent readers here will know that simply looking at the total costs can be misleading because storms that hit is the past encountered very different levels of development and population along the coast. Hence, storms of the past would undoubtedly cause far more damage were they to hit with today’s levels of coastal development. To account for this Chris Landsea and I developed a methodology for “normalizing” historical losses to present day values (see this paper in PDF). We think that the data represents a fair adjustment to the data because we can identify a climate signal in the resulting dataset (i.e., the ENSO signal, see this paper in PDF and the data are consistent with the estimates of catastrophe models used in the insurance industry, see this paper in PDF) Once the data are adjusted to 2004 values a different picture emerges on the impacts of historical storms. Here is data (in PDF) from the NHC, including Katrina:
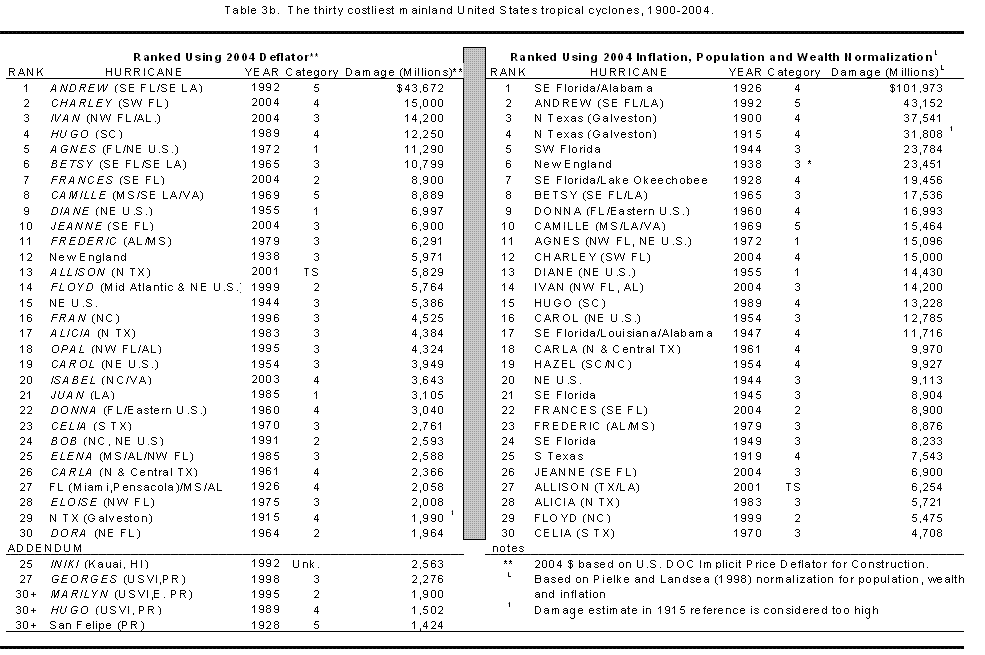
1. Katrina $125B
2. 1926 Miami $102B
3. Andrew $43B
4. Galveston 1900 $38B
5. Galveston 1915 $32B
And if you take a close look at this ranking you’ll see that only 5 of the top 20 most damaging storms occurred since 1970! We are in the process of updating our analysis of normalized losses and hope to have an updated database following hurricane season this year.
But is $125 billion an accurate estimate for Katrina? Damage estimates are not precise and estimates for individual storms can have large errors (e.g., see this paper in PDF). Consider for example how the total damage for Ivan (2004) was determined. The NHC often uses a simple estimate that total damages are equal to twice the insured damages (and there is empirical evidence to suggest that this is a reasonable assumption, see this paper in PDF). Consider this from the 2004 NHC report on Ivan which describes how the $14.2 billion estimate was arrived at:
“A total of 686,700 claims were filed and the American Insurance Services Group estimates (14 December 2004 re-survey) that insured losses in the United States from Hurricane Ivan totaled $7.11 billion, of which more than $4 billion occurred in Florida alone. Using a two-to-one ratio of insured damages yields an estimated U.S. loss of approximately $14.2 billion.”
But this approach can be inaccurate when there are unprecedented federal disaster packages such as we see with Katrina. This creates several problems for our normalized database that we will have to grapple with as we update the data this year. First, large federal disaster packages are a product of the late 20th century (see, e.g., this paper in PDF). There were no such packages before 1950 and without a doubt the costs of, say, the 1926 Miami storm would be far higher today than we estimate simply because of this factor. Second, federal costs throw off the relationship of insured to total losses. I have seen insurance industry loss estimates of up to $30 billion. This would suggest, under the methods used by the NHC to estimate losses in recent decades, that Katrina’s total impact would be about $60 billion. Of course the disaster in New Orleans is extremely unique. So we will have to grapple with these issues as we consider how best to add Katrina to the hurricane loss database, and what, if any adjustments should result to estimates from the distant past.
For now, I’d urge some caution in comparing Katrina directly to historical hurricanes. It is certainly safe to say that it is one of the top two most costly storms in the normalized database, and one can make a good argument for it being number one. But we also have to recognize that historical losses (pre-1950) may significantly underestimate the total costs of storms today, particularly for those storms with the largest impacts because of the large role played by the federal government today in disaster assistance.
For further reading (available here):
Pielke, Jr., R. A., and C. W. Landsea, 1998: Normalized Hurricane Damages in the United States: 1925-95. Weather and Forecasting, American Meteorological Society, Vol. 13, 621-631.
Pielke, Jr., R.A., and C.W. Landsea, 1999: La Nia, El Nio, and Atlantic Hurricane Damages in the United States. Bulletin of the American Meteorological Society, 80, 10, 2027-2033.
Pielke, Jr., R. A., C. W. Landsea, M. Downton, and R. Muslin, 1999: Evaluation of Catastrophe Models Using a Normalized Historical Record: Why It Is needed and How To Do It. Journal of Insurance Regulation. 18, pp. 177-194.
Downton, M. and R.A. Pielke, Jr., 2001: Discretion Without Accountability: Politics, Flood Damage, and Climate, Natural Hazards Review, 2(4):157-166.
Downton, M. and R. A. Pielke, Jr., 2005. How Accurate are Disaster Loss Data? The Case of U.S. Flood Damage, Natural Hazards, Vol. 35, No. 2, pp. 211-228.