February 5, 2015
The Precipitous Decline in US Flood Damage as a Percentage of GDP
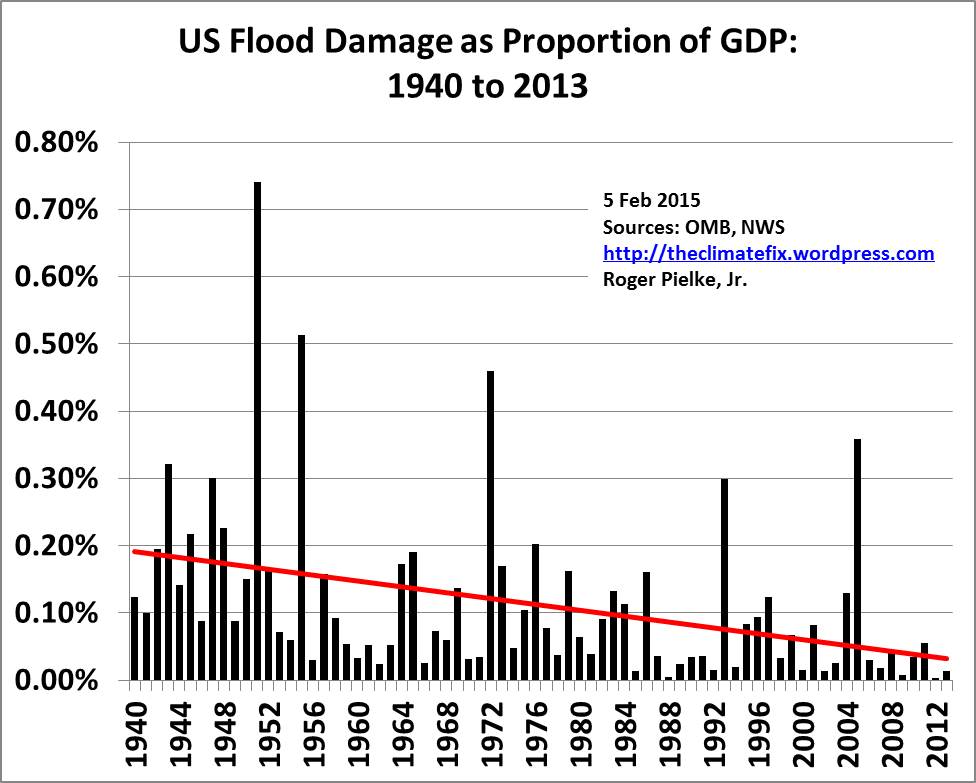 The graph above is an update from a version I first showed in Congressional testimony in 2013 (PDF). It shows US flood damage (as recorded by the NWS in 2013 $) as a proportion of US GDP (as recorded by the OMB, also in 2013 $, Table 10.1 here). The graph starts in 1940 because this is the start of the OMB GDP dataset.
The US is prone to very large flood events, resulting in tens of billions of dollars in losses. However, the trend since 1940 is striking. As the nation has seen its economic activity expand by a factor of almost 13, flood losses as a proportion of that activity have dropped by about 75%.
Please don't use this data to say anything about the incidence of flooding in the US or changes in climate. For that, I urge you to look at data and research, discussed here. You'll find very little evidence of increasing flood frequency or magnitude either in the US or globally. Regardless, the diminishing economic impact of floods in the US is undeniable.