January 12, 2015
Global Tropical Cyclone Landfalls, 1970-2014
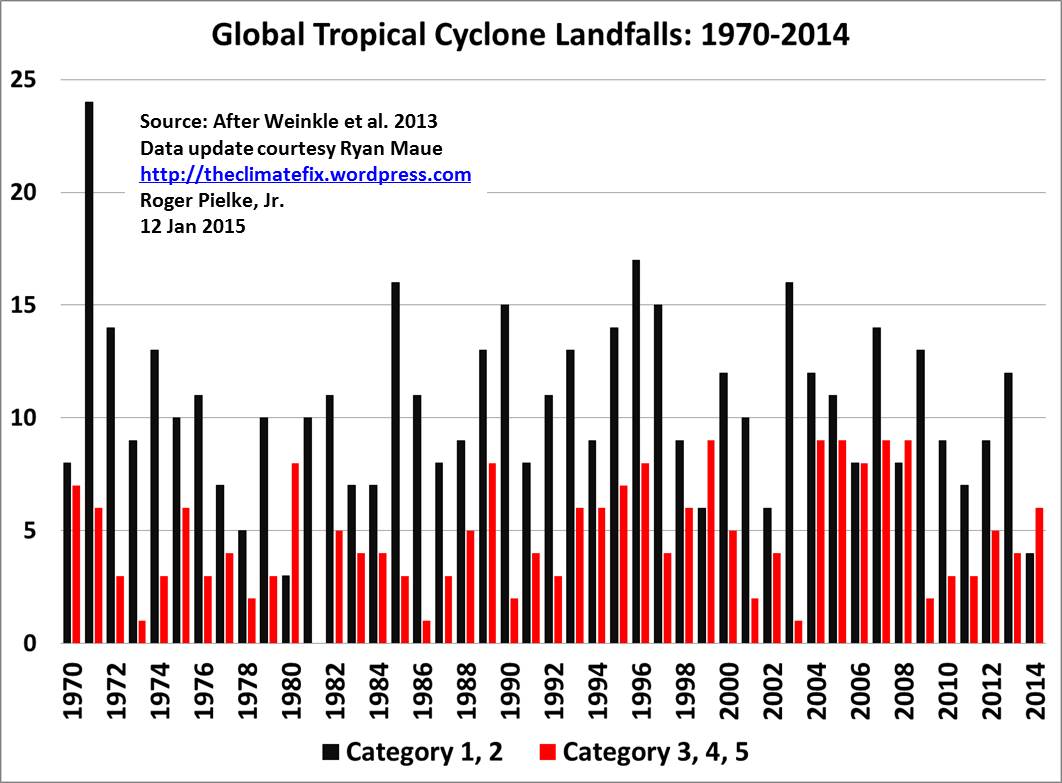
Above is an update on the data first presented in Weinkle et al. 2013, courtesy of Ryan Maue (@ryanmaue). The graph shows the number of landfalling tropical cyclones worldwide for 1970 through 2014. The data is broken down into weak (S/S category 1 and 2) and strong (S/S categories 3+) storms. For the definition of a landfall and other methodological details, please see the paper.
Some interesting points:
- 2014 had 10 total landfalls. This is second lowest (tied with 4 other years) since 1970. The lowest was 1978 with 7.
- The past four years have seen 50 total landfalls, the lowest four-year total since 1982. 1978-1981 had the lowest, with 41.
- The annual averages over 1970-2015 are: 15.3 total, 10.5 Cat 1&2, 4.7 Cat 3+.
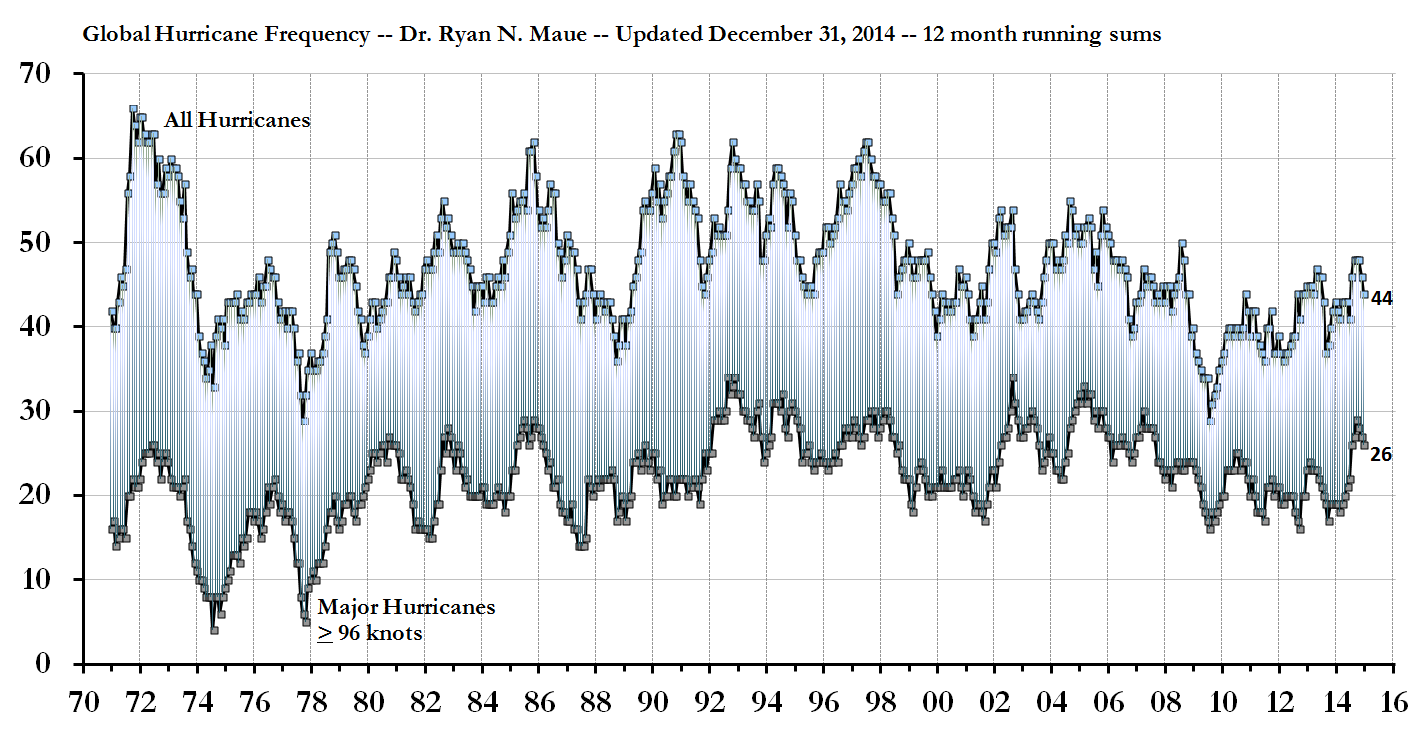
If you are interested in more data on global tropical cyclone activity, please visit Ryan Maue's Global Tropical Cyclone Activity page. From that page, below are trends in all tropical cyclones of hurricane strength, not just those that make landfall.